


Blue Ventures is a global marine conservation organization that works alongside communities and partners to support sustainable fisheries management. Over the past few years, the organization has invested heavily in its data science capabilities — an enabling function it relies on to help partners collect, manage, and act on their own data.
Scaling that side of the business surfaced a need to create a shared approach to designing with users in mind. Blue Ventures partnered with Designlab for a customized data visualization training that brought together its multidisciplinary data team spanning software development, data engineering, marine science, and program evaluation.
Through three live sessions and hands-on coursework spanning four weeks, the 15 team members built a shared framework for designing, structuring, and critiquing data visualizations — then applied it directly to the dashboards they were already building for partners.
Challenge
Blue Ventures' data science team provides tools to support community-based fisheries management across the world. They build data systems, applications, and dashboards that help partners on the ground collect, analyze, and act on fisheries, ecological, and socioeconomic data.
That work puts the team squarely between data collection and data use: raw fisheries and ecological data comes in from partners and community-based collection tools, and Blue Ventures turns it into the dashboards and visualizations that make that data usable. Closing that gap quickly matters, since delayed data loses value fast. “The value and the meaning drop significantly if you collect some fisheries data, and then two years later you’re trying to make a decision based on data that may have changed,” says Laura Mudge, Blue Ventures’ Director of Data Science.
As the team became more multidisciplinary, software developers, marine scientists, data engineers, analysts, and program evaluation specialists were all contributing to designing data products, but there wasn't a shared framework for deciding how those products should be designed, critiqued, or improved.
"Currently we lack a key designer,” says Laura, “so design is dispersed among many roles."
At the same time, the team serves a broad set of audiences. Community organizations, conservation partners, local NGOs, and donors all rely on Blue Ventures' data to answer different questions and make decisions.
Together, these challenges pointed to a need for:
- shared data visualization principles across a multidisciplinary team
- stronger user-centered design practices
- more consistent approaches to dashboard design and critique
- a common language for communicating design decisions
Solution
Through a grant from Cisco, Blue Ventures partnered with Designlab on a customized three-session data visualization training designed around the team's existing workflows, products, and goals, including building dashboards that partners could put to use immediately.
The team wanted to be able to more quickly build dashboards that partners could put to use immediately.
At the same time, the Blue Ventures team needed to help clients better understand how they could use the data for decision-making. One takeaway from the training was learning to distinguish between what stakeholders requested and what they actually needed.
Instead of focusing only on charts and dashboards, the training, led by Designlab instructor and mentor, Warren Nugent, began with a fundamental question: how can data products better support the decisions users are trying to make?
With curriculum built around Blue Ventures’ products and use cases, rather than generic exercises, the team learned to apply foundational design principles to their dashboards while asking deeper questions about the intended audience, the decision being made, and the best format to communicate the information.
Throughout the sessions, the team worked on exercises that aligned with Blue Ventures' real work — evaluating dashboards, discussing user needs, and applying concepts to products already in development.
“It was an insightful course, inlaying the foundation of practical design principles.”
The training also introduced a process for structured critique that helped the team evaluate visualizations more systematically. Rather than rely on subjective opinions, the team learned to assess every dashboard through a common sequence of questions about the decision being supported, the audience, the evidence being presented, and anything that might create friction for users.
"The mix was really valuable,” Laura says. “The presentation practice is what helped us get to a shared understanding point."
Key Outcomes
A Shared Design Language
The team didn't just learn visualization best practices, but Laura feels they’re now on the same page about how data products should be designed and reviewed moving forward.
"We understand what's expected when we design these things and the questions we ask."
That shared language has become especially valuable because Blue Ventures operates as a globally distributed team. Whoever fields a design request needs to work from the same expectations for project development.
"Now we have a shared understanding...how's that conversation going to go? What information are you going to gather? What are you going to bring to the team? That process has definitely improved."
Standardized Team Processes
Beyond changing how the team talks about design, Blue Ventures translated the training directly into its documentation and its work in progress.
"We took all those guiding principles and looked at what we're doing, what we could be doing better, and implemented them."
The team updated its internal design process documentation using concepts from the training, creating a stronger foundation for future dashboard development.
They also began applying lessons directly to dashboards already under development. "We've reworked some of the wireframes, changed visualizations, and made some things simpler."
More Confident Critique and Better Design Decisions
Laura identified the training's structured critique framework as one of the biggest "light bulb" moments for the team.
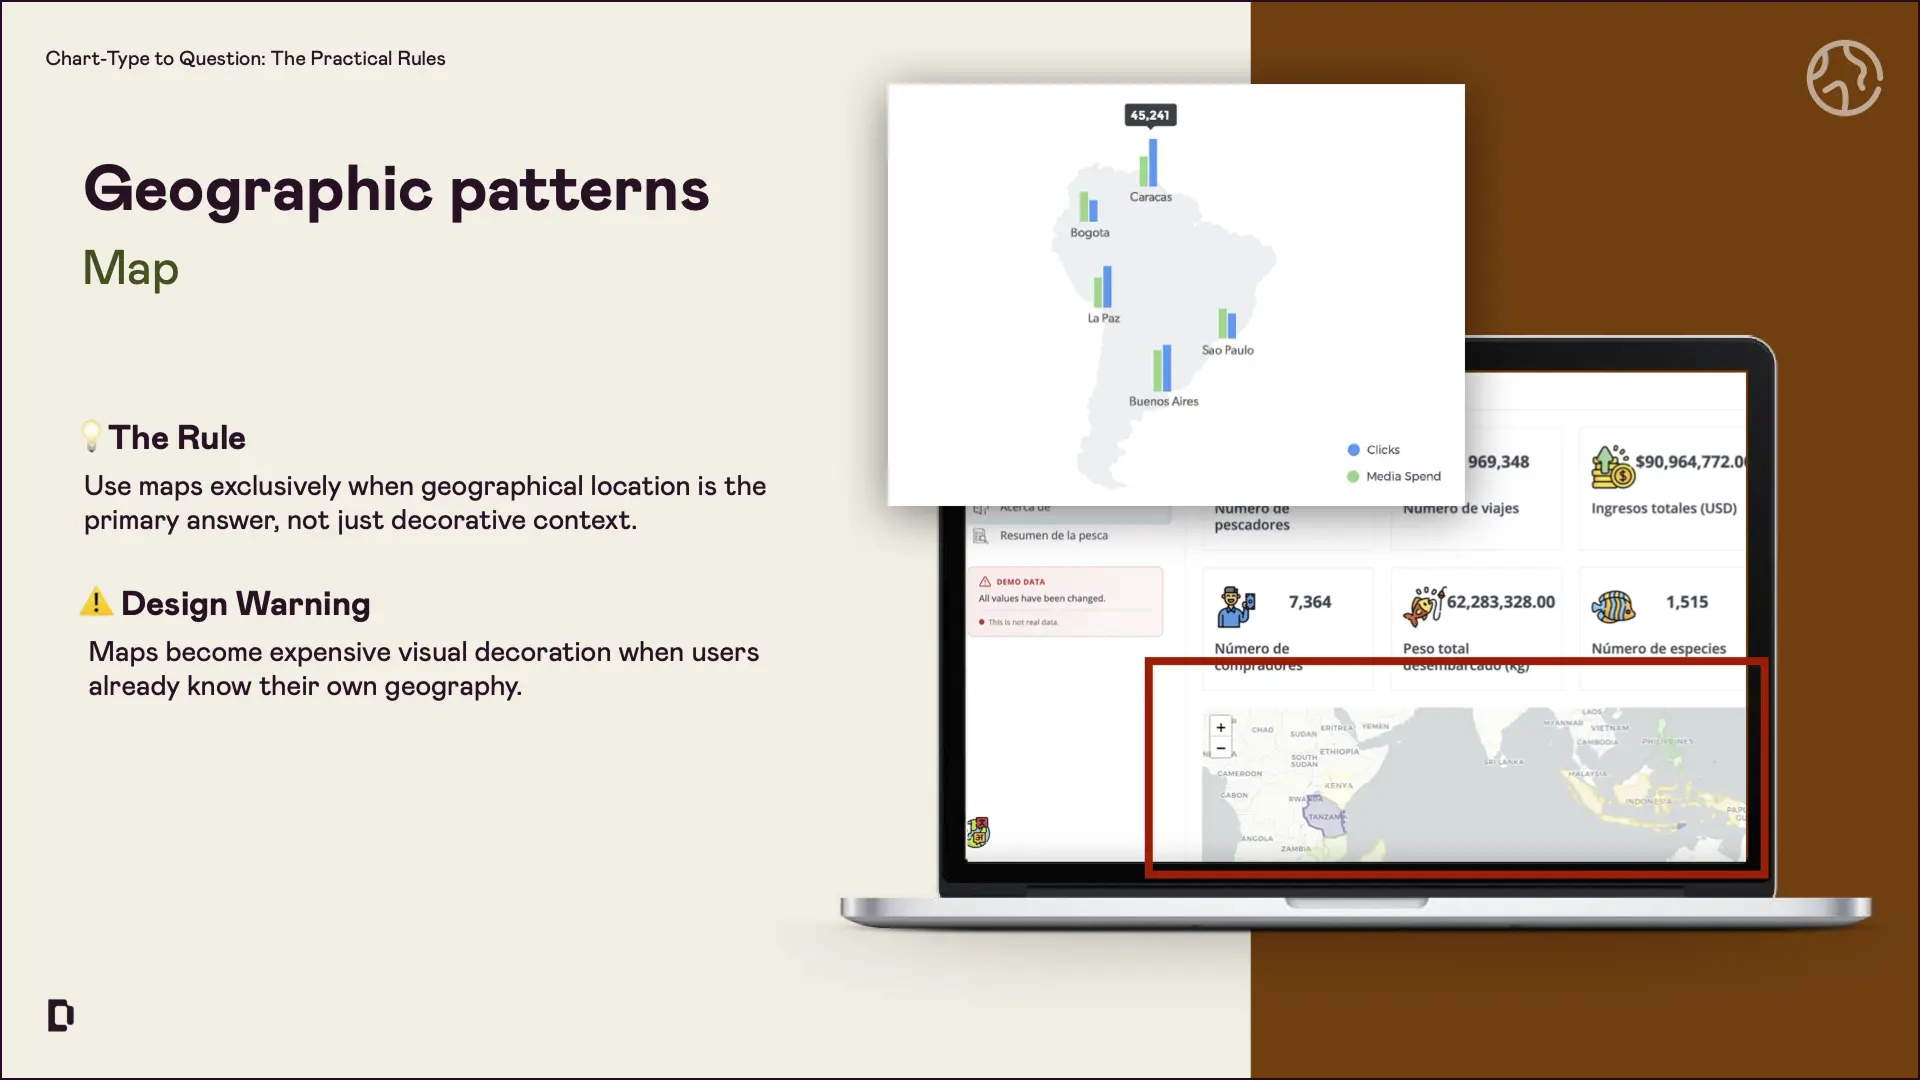
In practice, that meant working through a shared set of critique questions for every dashboard — testing for things like evidence and encoding, and asking what creates friction for a viewer: What would slow this person down? What could be removed, simplified, or moved out of the way? Are there too many unexplained acronyms, too much raw data, or too many summary stats competing for attention?
"Folks feel a little more confident about how to give feedback and critique."
That shift has begun influencing design reviews and product discussions across the organization.
"That was a light bulb moment...how we should be critiquing the things that we’re making."
Designing Around User Needs
Perhaps the biggest mindset shift was learning to begin with users, not outputs. The team now spends more time understanding the decisions users need to make before deciding how information should be presented.
That has been especially valuable because Blue Ventures serves such a diverse range of stakeholders, from local fishing communities to international donors — each requiring different types of information and different ways of interpreting it.
Laura points to an example: "We have this one indicator — how might we show that to a community versus a donor investor? We’re thinking more about that."
By grounding design decisions in user needs, the team is creating more intentional data products that better support decision-making for partners.
.webp)
Conclusion
Investing in data visualization training helped Blue Ventures build a consistent design practice for its multidisciplinary team, one that will help them turn complex environmental data into meaningful action for their partners.
By establishing consistent design principles, improving critique processes, and embedding user-centered thinking into every project, the training has given the team a stronger foundation for designing data products that better support communities, partners, and conservation efforts around the world.
There’s still a broad backlog of existing dashboards to apply these lessons to, but Laura says the training already hit the mark for what her team needed and gave them a shared foundation to keep building on.
If your team could benefit from custom training, Designlab provides training solutions based on your goals. Learn more, or contact us directly to talk through options.


.webp)


.webp)