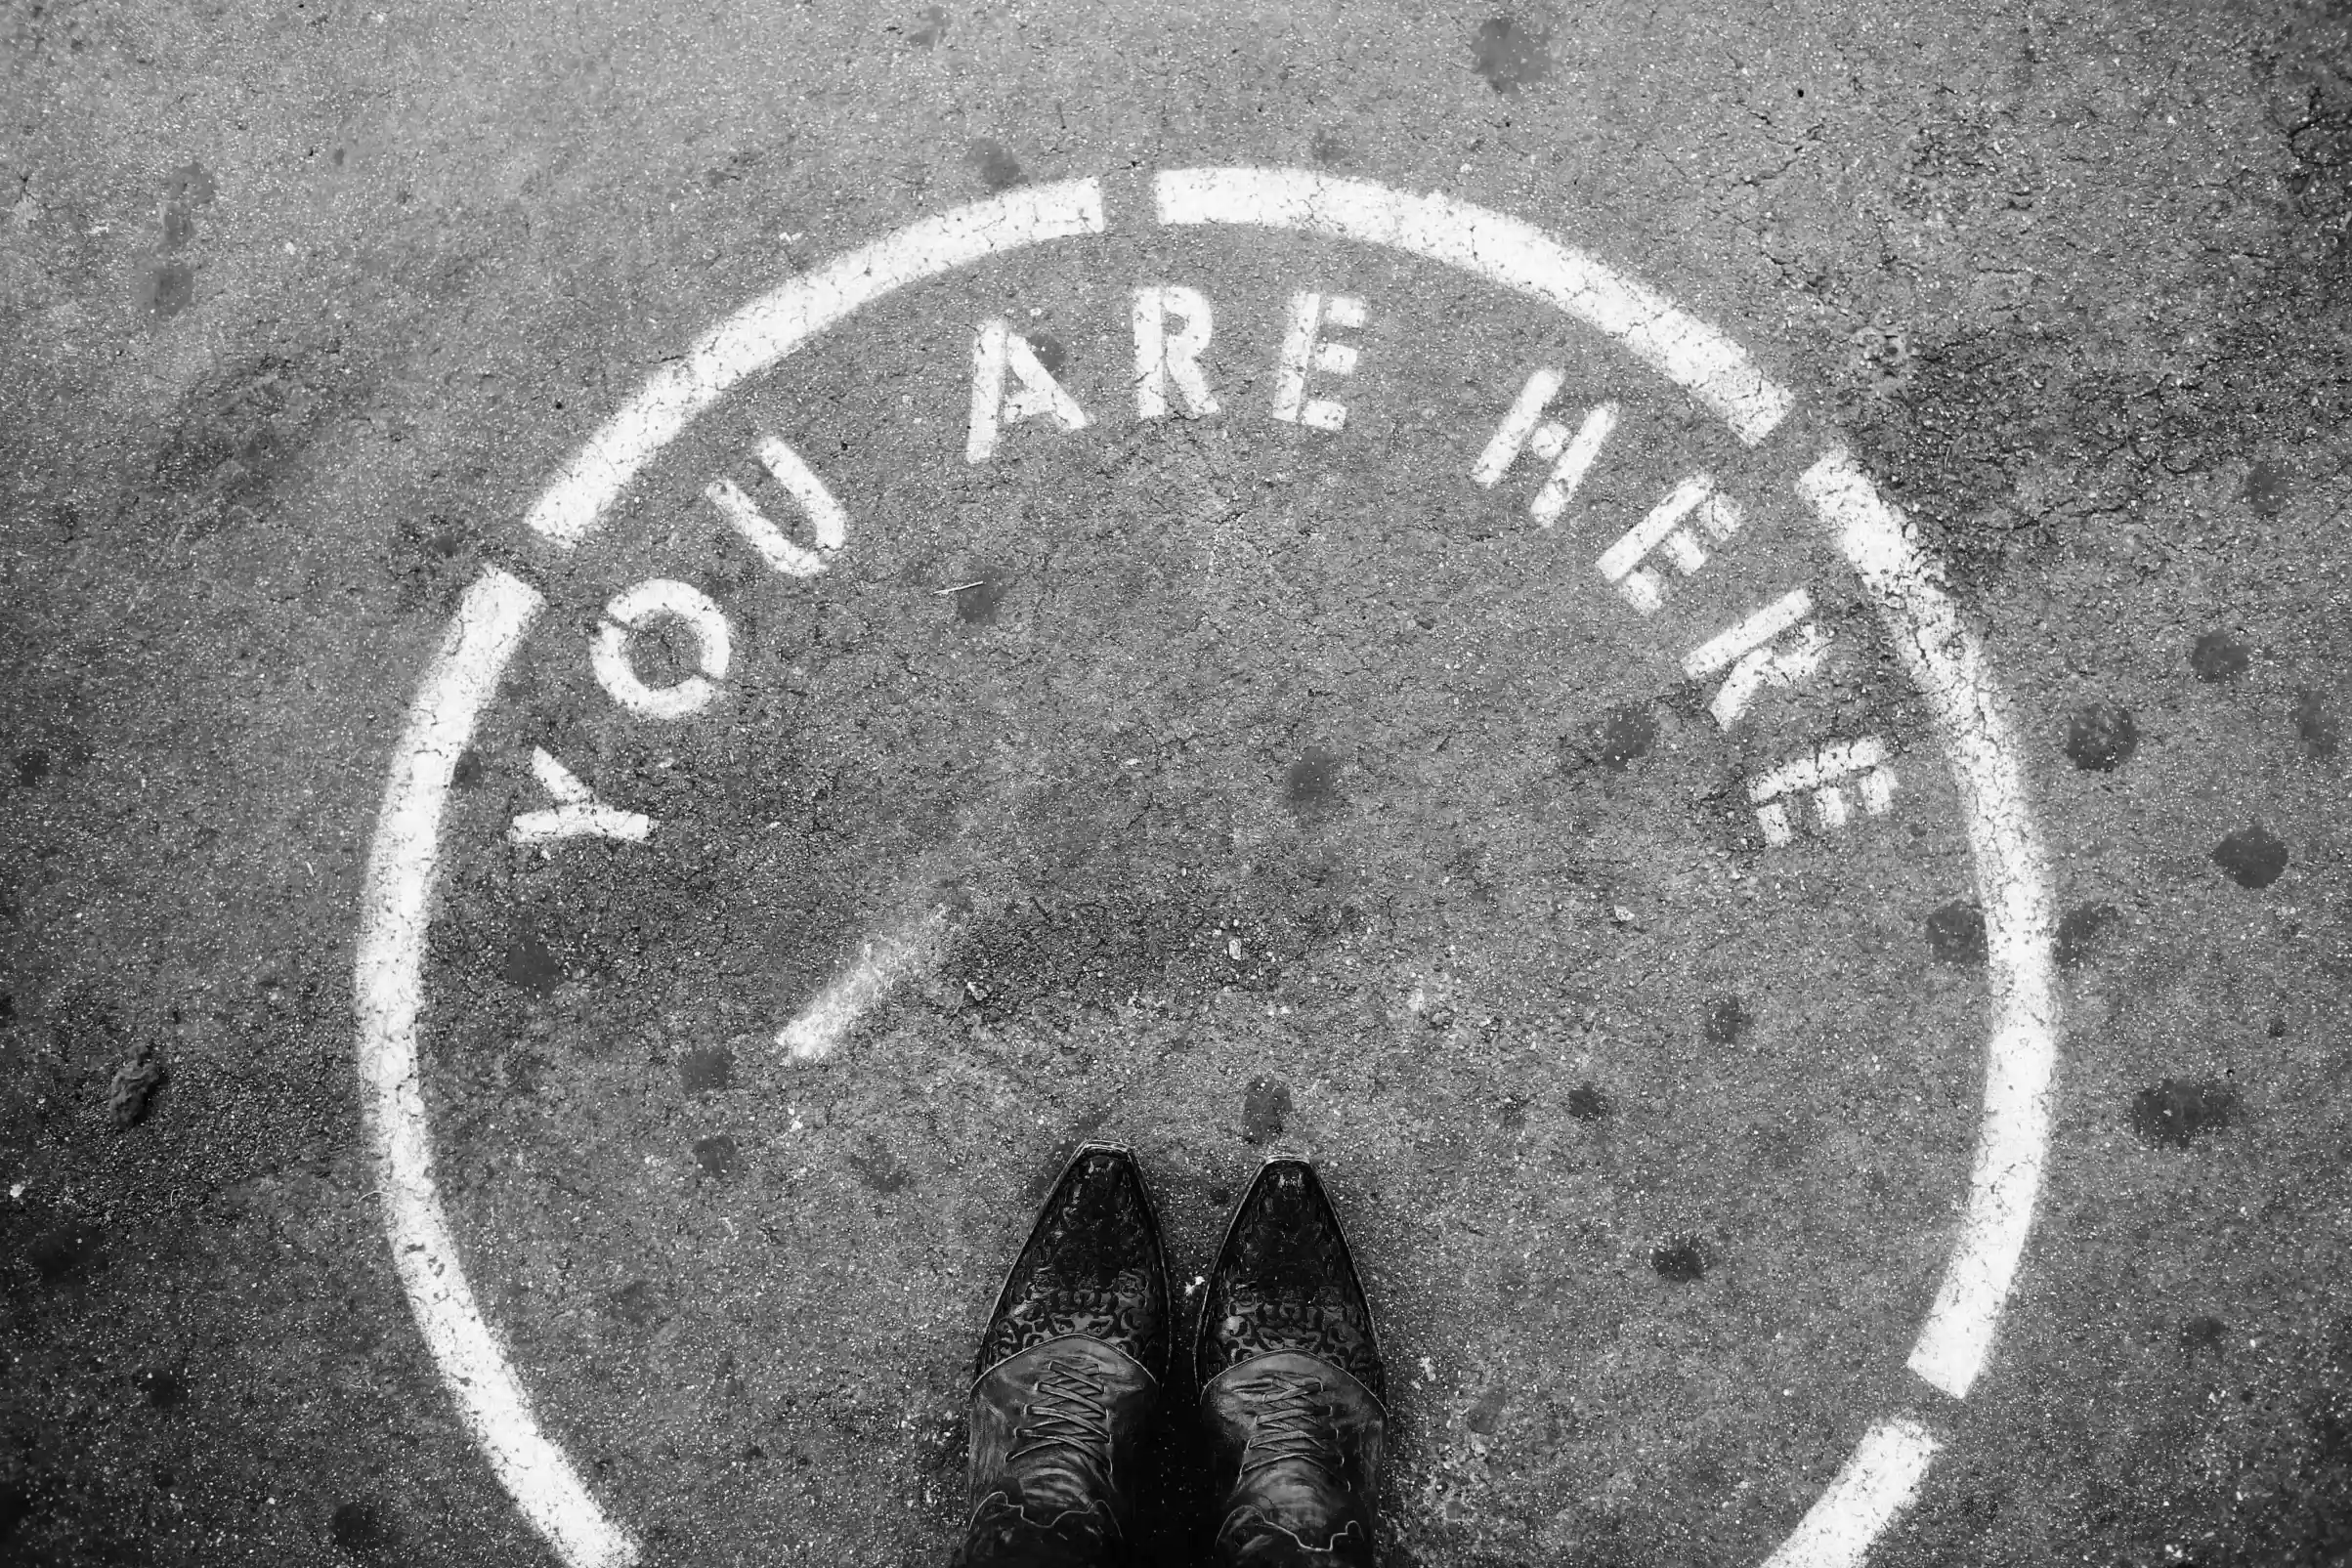
Successful product design requires more than a brilliant idea and a team of talented implementers. It also requires a deep understanding of who the users are, and how they experience the product.
No matter how experienced the design team is or how many successful products they've created and launched, there is never a substitute for user data. The reason for this is simple:
Designers are not users.
Without data, there is no way to concretely validate your assumptions to ensure that you're creating designs that meet the needs of your users.
No matter how experienced a designer is, the only way to create a product or service that truly fits the needs of the intended users is by using data that’s obtained from observing and communicating with your users directly.
- What is Data-Driven Design and Why Does It Matter to UX?
- Types of Data: Quantitative and Qualitative
- How to Understand Your Data to Learn What Matters to Users
- How to Present Your Data to Win Stakeholders
- Key Takeaways
What is Data-Driven Design and Why Does It Matter to UX?
Data-driven design is the practice of basing your design decisions on data rather than intuition or personal preference.
It requires an ongoing commitment and understanding of the value of this data, to the point where the entire design process is structured around obtaining and analyzing research. Without data, user experience design does not exist; the end result is limited to the design team's perceptions and experiences.
When you begin your design journey, you can start to form data-driven design habits by embracing user research and testing (collecting the data), and using the insights gleaned to arrive at your design decisions.
As you advance in your career, data mastery will play an increasing role in how you formulate your design strategy and emerge as a leader in your field.
Types of Data: Quantitative and Qualitative
Data-driven UX design uses two main types of data: qualitative and quantitative.
Quantitative Data Collection Sources
Quantitative data is objective data that can be measured through concrete numbers or values. However, the meaning behind this data is open to interpretation. Quantitative data collection sources include:
- Analytics data, from sources like Google Analytics or Mixpanel, shows page views, clicks and bounce rates.
- Usability test results that measure how long it takes for users to complete a task or find a specific piece of information.
- Heat maps which show exactly where users click on your website or product.
- A/B testing which tests single variants to see which performs better.
- Multivariate testing, which uses multiple variants to test a hypotheses.
- Usage analytics which comes from actual user interactions with a product or service. This data can give information about how users navigate through a website, what features they use the most, and how long they stay on a page.
Qualitative Data Collection Sources
Unlike quantitative data, qualitative data is subjective and cannot be measured objectively. However, qualitative data offers perspective and a richer insight into the why behind user behavior.
You can gather qualitative data through UX research methods such as:
- User Interviews, where users share responses to a predetermined set of questions.
- Focus groups, where a group of users talk about a product or experience in a moderated conversational setting.
- Surveys, where users leave written feedback on their product experience and opinions.
- User feedback, which is gathered from surveys, interviews, focus groups, and other research methods. This type of data tells us about users' needs and preferences.
While any kind of data is valuable, collecting a combination of quantitative and qualitative data can help create a more complete understanding of the greater context behind a user's actions or opinions.
Read more: AI Tools to Streamline & Enhance the User Research Process
[MID_ARTICLE_CTA]
How to Understand Your Data to Learn What Matters to Users
Collecting data about user behavior is the first step to establishing a greater understanding of your target audience. The next step is to analyze the results from all your research to uncover the themes or insights that will inform your design decisions moving forward.
Empathy Mapping
An empathy map is a powerful visual tool that helps you better understand your customers by organizing their behavior and motivation. It’s essentially a visual representation of what your users are thinking and feeling as they interact with your product or service—allowing you to step into your customer's shoes and gain insight into their needs, wants, and desires.
Affinity Mapping
An exercise called affinity mapping, or affinity diagramming, can be used to identify patterns from qualitative data.
The process is fairly straightforward:
- Each note from your research should be written on a separate sticky note (or if you're conducting this exercise online, you can use a whiteboard tool like Miro or InVision).
- As you review your notes, look for similar patterns or themes.
- Sort your cards into groups according to which theme they belong to.
- Review each theme and write out a summary of what this says or reveals about the users and their experience.

How to Analyze Quantitative Data
Quantitative data can be more straightforward in terms of identifying patterns and weak areas in your product.
For example, depending on what you've tested, specific patterns will often arise on their own: data from Google Analytics might show a particular page with a high bounce rate or low time-on-page, indicating that users have lost interest in your site. Within a product, you might see an increase in clicks on your help button that indicate confusion or a lack of usability within a feature or screen.
Read more: Measuring What Matters: A Deep Dive Into Product Metrics
Regardless of the patterns that emerge, it might take additional research to understand the why behind your user behavior data. (What about this page makes users click away? Is it because they found what they needed, or because the information was not helpful or digestible? Is there a way we can restructure or improve this flow to engage with them or provide more meaningful value?)
How to Present Your Data to Win Stakeholders
Ideally, every design team and company would understand the value of a data informed design process. Unfortunately, this isn't always the case.
Part of your responsibility as a UX designer or UX researcher is to present the data to your team and relevant stakeholders. Since this data can be jarring (it might disprove someone's well-intentioned idea and require additional time and resources to readjust the design), it's always important to create a well-rounded presentation that not only shares the data results, but also connects your research to other areas of the business.

Using data visualization tools like graphs, accompanying research quotes with user photos, and drawing correlations with specific stakeholder requirements can help to captivate your audience and realign their goals with user goals.
Ultimately, the decision to change a product or feature often lies outside of the work of a UX designer, so the more compelling your research and presentation, the more likely it is to achieve the results you're hoping for.
The Value of Data For Your Design Career
When you're just starting your journey of becomign a UX, UI, or Product Designer, data can feel somewhat irrelevant. After all: you're becoming a designer, not a data analyst.
But data is a foundational piece of UX design, and is key to ensuring that your designs don't just look good: they deliver the results that the users—and the company you work for—need to succeed.
The sooner you learn how to confidently collect, analyze, and present data to your team, the more value you'll be able to offer to your collaborators, present, and future employers.
Key Takeaways
Collecting data is a tool, not a solution. By itself, even the most specific quantitative data is not enough to tell you what needs to be iterated or improved in your product design.
But once you've collected the appropriate data, your product design team can work together to create compelling designs that enhance the user experience.
By moving towards a data informed design process, you open the door to ongoing research that can help you design more successful, profitable products—and better support the users.
How to Get Started Using Data with UX Design
Data is a foundational part of UX design, no matter where you're at in your career journey. It's a skill that's necessary as you begin, which is why our career-switching bootcamp, UX Academy, teaches you how to conduct user research and testing as you build a job-ready portfolio.
As you gain design experience in the field, it's important to also deepen your mastery of data-driven design, as it's a skill that's integral to becoming a leader on your team and the company as a whole. In our Data-Driven Design course, we help you reach that next level so that you can open new doors for your product design career.


.webp)